Highlighted Stories
Mapping Child Poverty: Using Machine Learning to provide a more Granular Picture of Child Poverty in Sub-Saharan Africa
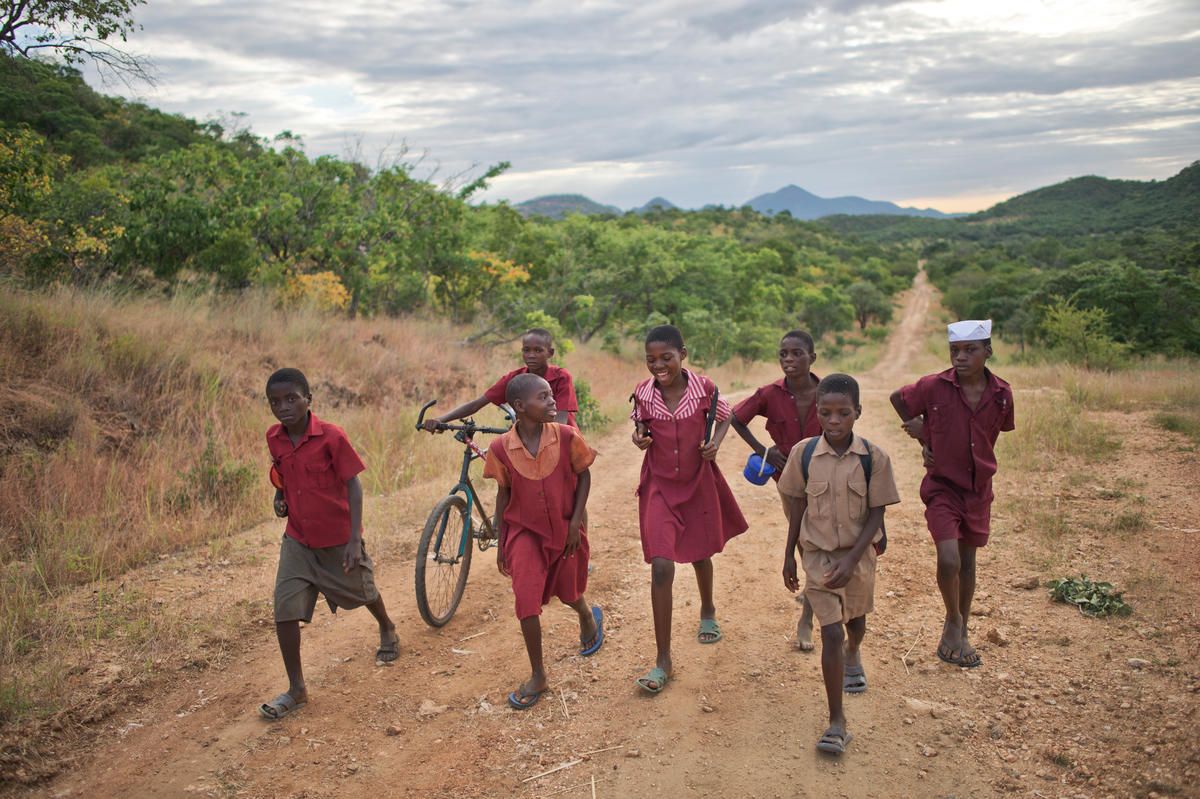
1 billion children live in multidimensional poverty. This means that more than 4 in 10 children are severely deprived of rights that constitute poverty, for example because they don't go to school, don't have access to health care, are malnourished, live in overcrowded conditions or lack basic clean water and sanitation. Our previous work suggested that the COVID-19 pandemic and its socio-economic impact may have resulted in an additional 100 million children living in poverty.
Measuring child poverty via national household surveys
How do we know this? Our estimates are based mainly on household surveys such as Demographic and Health Surveys (DHS) and Multi-Indicator Cluster Surveys (MICS). These surveys are conducted every few years in most low- and middle-income countries and ask thousands of households about living conditions, access to education or health care, and many other things. However, these questions cannot be asked of every family in a country, but only of a small sample that is representative of the whole population. As a result, we can use these surveys to estimate the prevalence and depth of child poverty (and many other things) both nationally and down to a sub-national level (in most countries this is states or provinces). Those surveys are extremely valuable to understand children’s lives in different contexts and the source for many indicators in the Child Atlas.
However, these data leave us in the dark about where exactly poor children live, as we cannot zoom in further than these sub-national levels. But if we don't know which districts or villages are particularly affected, how can local governments, civil society and NGOs know that their programmes and activities are reaching those most affected by inequality and discrimination? It also limits our understanding of the links between child poverty and climate change or conflict, as we often simply do not know whether children living in poverty are also living in a conflict zone, or are particularly vulnerable to natural disasters or other environmental risks. We therefore need a much more detailed understanding of the distribution of child poverty.
Mapping poverty locally with machine learning models
Poverty maps and small area estimates are one way of addressing this challenge. The idea is to combine household survey data with satellite imagery (e.g. night lights), information on public and private infrastructure (road density, location of critical infrastructure, travel time to hospitals, mobile phone towers and connection speed, etc.) and other possibly relevant variables (altitude, vegetation, pollution, etc.). A machine learning model then takes much of the original household survey information (from those surveys where GPS information gives us the approximate location of the household) and tries to identify a relationship between these households and a wide range of possible influencing factors. For example, do poorer children tend to live in areas with less light, have longer journeys to health facilities, or live in areas with less road density? The algorithm then uses these insights to predict poverty at a very granular level. These predictions are then tested against 'ground truth' (often another dataset or an unused part of the original household survey data) to understand how well it predicts actual poverty levels.
Such poverty maps are not new, and small area estimates of monetary poverty or wealth exist in many countries. However, this has not been done for multidimensional child poverty for a large number of countries. This leaves us guessing where the poorest children live.
Limitations and potential of poverty maps
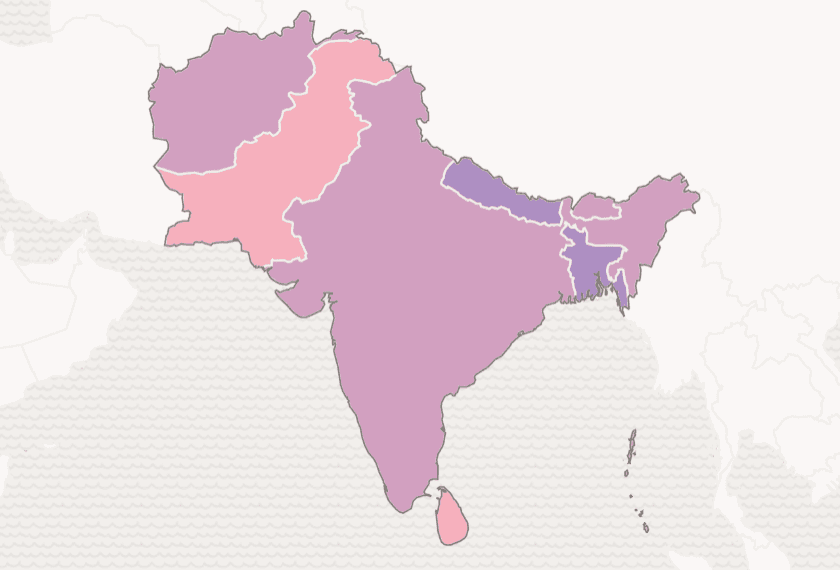
Save the Children has been working with fellows from the University of Warwick's Data Science for Social Good initiative and UNICEF to fill this data gap. A newly developed and innovative machine learning model estimates child poverty across sub-Saharan Africa, following the idea outlined above. The end result is a granular map (in our case hexagons with an average area of 5.16 km²) of the prevalence and depth of child poverty across the region. You can read our methodological summary here, and the full model is open source for anyone to use and improve.
Any such analysis can only be an estimate. This is very much the case with our model, and the quality of our predictions varies somewhat from country to country (especially as we are trying to estimate across a continent and not just a single country). We add prediction intervals to the dataset to illustrate this uncertainty. But we also need to be careful how we use such estimates and make sure we don't jump to conclusions based on very small estimates that may have large confidence intervals attached to them.
But this should not detract from the value of these estimates: for the first time we have a detailed understanding of how much child poverty varies within countries in sub-Saharan Africa, and where exactly we would expect to find the poorest children. And it shows what is possible when using a machine learning model and a wealth of (publicly available) data – something we hope many countries will follow to produce their own small area estimates that can then be used to inform policy and programming decisions.
The path forward: refining poverty maps and linking them to policy
This is only the beginning of the journey. While the level of poverty may change over time, the spatial distribution of where the poor live can be quite persistent. This means that such poverty models can indeed have a relatively long shelf life. However, we would still like to better understand how the distribution changes over time, as this helps us to analyse and track child poverty in times of crisis, such as climate shocks, food inflation or conflict. We are also working to better understand the links between child poverty and climate risks, where this type of data can provide valuable insights – more on that soon!
Update August 2024: Unfortunately, we are no longer able to show the interactive graph with microestimates of child poverty. If you are still interested in the data, please reach directly out to us!
Related stories:
Related stories
How a Soap Opera Helped to Reduce Child Marriage
Child protection (CP)
Child protection (CP)
2025-12-09